Hi all,
It’s been a long time. The past few months were pretty hectic. I haver tons of drafts for new posts including complete tutorials but I guess they will have to wait for at least another month. In the meantime here is a small quick guide to enabling debugging for Websphere Message Broker flows. If you are like me, aside from tracing you always like a decent debugger for tracing code.
1. Install the Rational Agent Controller
Please remember that you need to choose a JDK other than the IBM JDK installed with the WMB. It is wise to choose a Java 5 JDK. This is the JDK the Rational Agent Controller uses to start a debugger instance and connect to the execution group.
2. Assign debug port to execution group and enable debugging
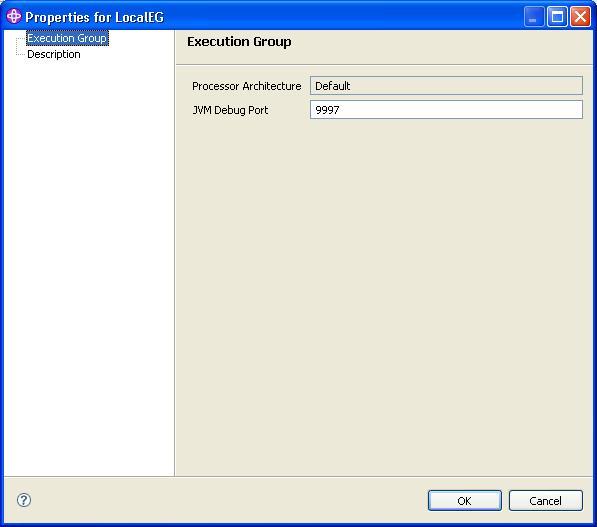
You need to assign a debug port to the execution group you want the debugger to attach to and enable debugging. Please remember that this can constitute a security vulnerability since the debug port should be accessible from outside.

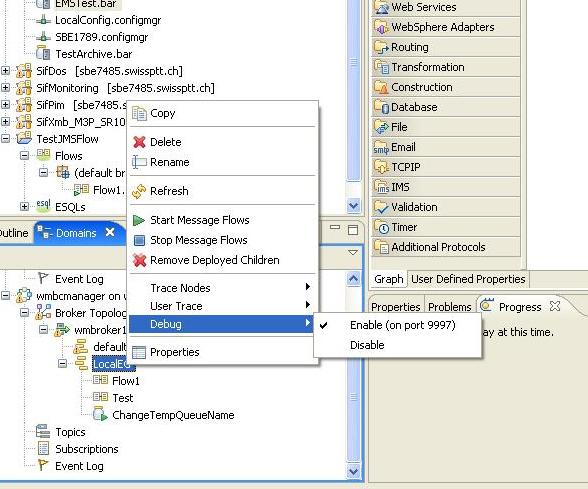
Next you should enable debugging;

3. Go to tthe command console and shoot;
mqsichangeproperties <broker-name> -e <execution-group-name> -o ComIbmJVMManager -n jvmDebugPort -v <port-number>
4. Restart the broker
5. Restart the broker toolkit
6. Create debug configuration
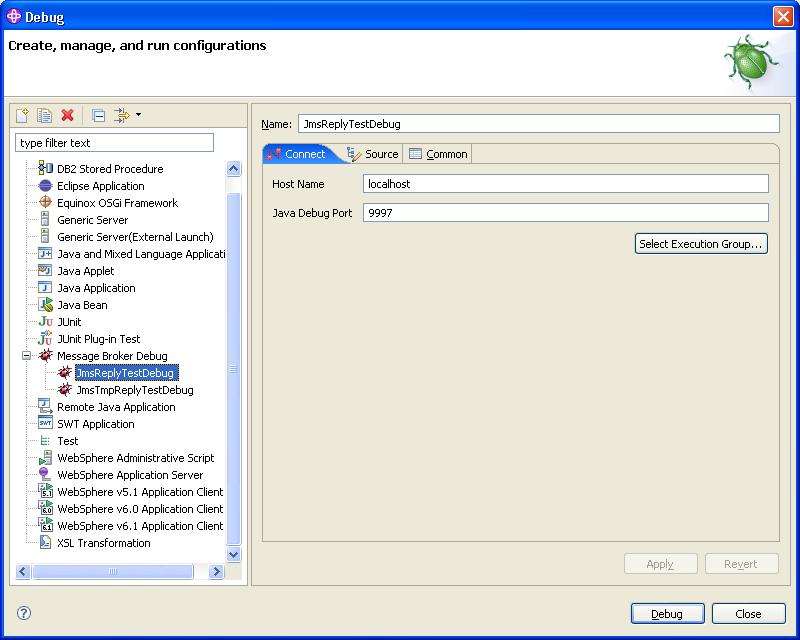
Create a new debug configuration by going to Debug… / Message Broker Debug / Add…
In the new configuration first click the “Select Execution Group…” which will result in the broker toolkit to query execution groups previously configured to discover the ones which have debugging enabled. Choose the execution group you have configured. Enter the debug port you have picked and add the Source folder to the debug configuration.

7. Add breakpoints to you flow and use the debug configuration you have created to debug your flows.
Environment: Rational Agent Controller v6.0.1, Websphere Message Broker 6.1.0.4
How did u identify this Debug port as 9997 ? Can we give any port number? I tried a couple of port #’s in my broker toolkit but nothing worked. It says cannot start the debugger.
Thanks,
Deepesh
Hi Deepesh,
Yes you can use any port. Have you restarted your broker toolkit? Also have you checked your firewall?
regards,
Selim
If you change the port in the Toolkit, you don’t have to issue the mqsichangeproperties command.
This site is very helpful to me to learn on De-bugging concept, I have a requirement to disable / remove debugging on Message Broker v6.1, I know it’s inbuild debugger available in MB6.1 without rational agent controller.
Could you please help me here.
How to debug line by line in WMB so that we can trap the variable values that is used in ESQL associated with a node/flow?
I know this is an old post but this process was helpful.
saddly at the moment I have created my broker and when I go to create a new configuration that option is unavailable.
I’ve scoured IBMs support and installed the latest hotfix with no luck
any suggestions?
how do you clear the debug cache